China Best Solar Panels What Are Solar Power Benefits?
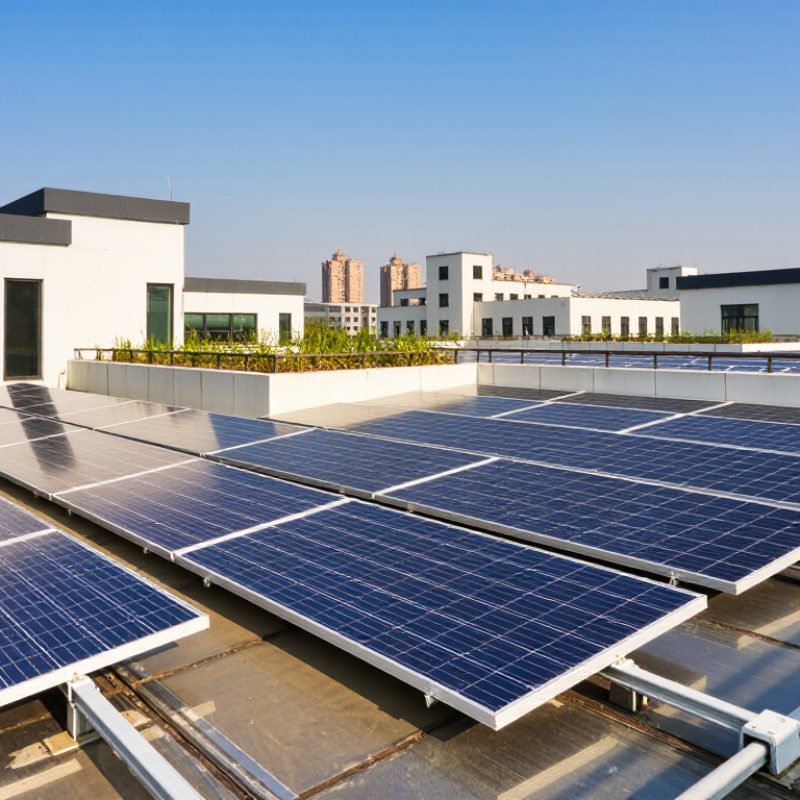
For households and businesses comparing China’s best solar panels, the real question is not simply which brand has the highest rated output. Buyers need to weigh efficiency, durability, warranties, installation quality, and local sunlight. A high-output panel may look impressive on paper, yet roof orientation and shade can change actual production.
China’s role in the market is substantial. The International Energy Agency’s 2022 report, Special Report on Solar PV Global Supply Chains, found that China held more than 80% of global manufacturing capacity across key photovoltaic supply-chain stages. That scale supports broad product availability, but it does not make every panel equally reliable. Price alone is a poor test. Check independent certifications, published performance data, and warranty terms, and ask who will handle service if a system underperforms.
The financial case has also strengthened. IRENA reported that the global weighted-average cost of electricity from newly commissioned utility-scale solar PV fell 12% in 2023, to USD 0.044 per kilowatt-hour. This is an industry benchmark, not a promise of household savings; local tariffs, financing, and installation costs matter. The solar power benefits can include lower grid electricity use, reduced operational emissions, and more predictable energy costs over time. Still, solar is not impact-free: manufacturing uses materials, and output falls at night or during cloudy weather. A careful comparison should look beyond headline efficiency and ask whether a panel suits the site, the budget, and the expected years of use.
Solar Panel Basics: How Photovoltaics Turn Sunlight into Electricity
Solar Panel Basics: How Photovoltaics Turn Sunlight into Electricity
A photovoltaic panel converts light directly into electricity, without moving parts. Sunlight arrives as photons. In a silicon cell, their energy frees electrons, while the cell’s internal electric field guides their movement. Connect the cell to a circuit, and that movement becomes direct current (DC). It is a quiet process. No spinning turbine is involved.
Homes and most appliances use alternating current (AC), so an inverter changes the panel’s DC output. The U.S. Department of Energy describes this conversion as a core part of a photovoltaic system. Output still varies: passing clouds, shade from a chimney, panel angle, and hot afternoons all matter. On a real roof, even a small shadow can affect production. That detail is easy to underestimate.
The global scale is already substantial. IEA PVPS reported more than 1.6 terawatts of installed photovoltaic capacity worldwide at the end of 2023. But installed capacity is not the same as constant output; panels produce less in low light and none at night. A battery can store some daytime energy, though storage adds cost and complexity. This is where neat diagrams feel incomplete. Site conditions deserve a closer look.
| Topic | Typical Value or Explanation | Practical Significance |
|---|---|---|
| How photovoltaic panels work | Photovoltaic cells absorb light and produce direct-current (DC) electricity. An inverter converts DC electricity into alternating current (AC) for household use or grid export. | Panels generate electricity from sunlight without combustion; output varies with sunlight, temperature, orientation, and shading. |
| Standard test conditions | Module ratings are commonly measured at 1,000 W/m² irradiance, a 25°C cell temperature, and an air-mass spectrum of AM 1.5. | These standardized conditions allow comparisons between modules but do not represent every real-world operating condition. |
| Illustrative module efficiency | A 400 W module with an area of about 1.9 m² has an approximate efficiency of 21% under standard test conditions. | Higher efficiency can produce more rated power from a given roof area. Actual module ratings and dimensions vary. |
| Illustrative energy production | A 1 kW solar array receiving 4 equivalent peak-sun-hours per day and operating at a 0.80 performance ratio would produce about 3.2 kWh per day, or about 1,170 kWh per year. | This is an estimate, not a site-specific forecast. Local sunlight, system design, weather, shading, and equipment affect production. |
| Temperature effect | Many crystalline-silicon modules have a power temperature coefficient around −0.3% to −0.5% per °C above the rated cell temperature. | Hot operating conditions can reduce instantaneous output relative to the standard test rating; good airflow behind panels can help limit heating. |
| Potential electricity-bill benefit | Solar can reduce grid electricity purchases when generation coincides with household demand. Savings depend on system cost, electricity prices, tariffs, and self-consumption. | Battery storage may shift some solar energy to later hours, but it adds equipment cost and does not guarantee a particular payback period. |
| Operational emissions | Solar photovoltaic systems generate electricity without direct fuel combustion during operation. | Manufacturing, transport, installation, and end-of-life processing still have environmental impacts; life-cycle emissions vary by technology and location. |
| Service life and degradation | Many modern modules are designed for decades of service. A commonly cited planning range for annual power degradation is roughly 0.3% to 0.8%, though product performance varies. | Long-term output depends on product quality, installation, climate, maintenance, and operating conditions. A performance estimate is not a guarantee. |
| Key factors before installation | Assess roof condition, usable area, orientation, tilt, shading, local solar resource, grid connection, and applicable rules. | A qualified site assessment can provide a more reliable production estimate and help determine whether solar suits the property. |
| Figures are general educational estimates, not product specifications or a financial forecast. Actual results vary by location, system design, weather, and usage. | ||
Related Posts
-
What Are the Top Benefits of Solar Power in 2026?
-
7 Best Home Energy Management Systems for Global Buyers
-
Explore Top Renewable Power Technology in China for Global Buyers?
-
What Is the Best Clean Energy Technology from China?
-

2026 Top Sustainable Living Solutions for Global Buyers?
-
Smart Energy Management Solutions for Global Procurement Needs?
Talk to a solar expert
Fill out the form and our team will be in touch with a free quote based on your local incentives and payment options.